

 Czech
Czech Slovak
 German
 Romanian
 Ukrainian
 Italian
 French
 Dutch
Dutch Polish
TOP 100 - The world's best-selling cars in 2021
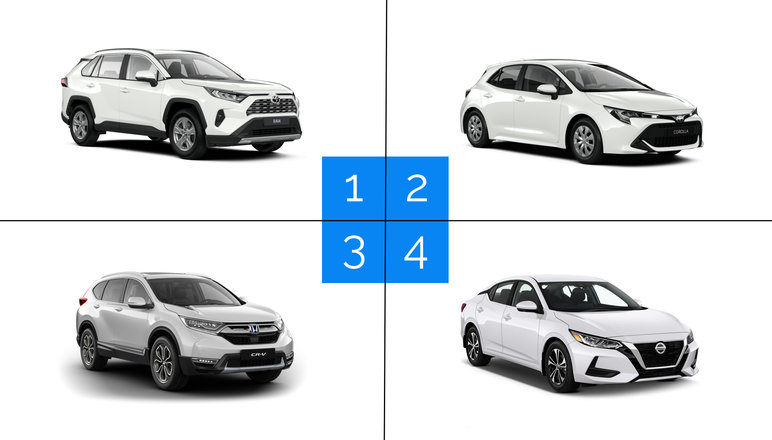
In 2021, the Toyota Corolla became the best-selling car of all time with more than 50 million units produced. It thus surpassed the legendary beetle and the Ford Model T. The jumper of the year is undoubtedly Tesla - its Model 3 made it into the TOP 10 for the first time.
Japanese domination
Japanese cars are undoubtedly the most popular in the world, as they occupy 7 places in the TOP 10 best-selling cars in the world. The Toyota RAV4 SUV took the very first place, beating the long-time matador of the Toyota Corolla ranking.
Cars of Japanese brands also occupy the majority of all TOP 100 best-selling cars. However, Korean and German carmakers are also doing very well.
Tesla is breaking the old order
The Tesla Model 3 came in ninth place, surpassing such names as the BMW 3 Series, Ram 1500 and Volkswagen Tiguan in sales. Last year, the Model 3 sold 508,000 units. A very good result is confirmed by the fact that electric cars from traditional brands did not make the rankings at all.
SUVs are the most popular
Classic body designs such as sedan, station wagon or hatchback are slowly but surely disappearing at the expense of SUVs. The ranking is full of them, despite the fact that, for example, sedans are still the most popular choice of drivers in many countries. The TOP 100 also includes representatives of kei cars - Japanese miniature cars. The Honda N-Box reached the 94th place with 189,000 units sold.
World's best-selling cars in 2021
| Place | Car model | Units sold | Comparison with 2020 |
|---|---|---|---|
| 1. | Toyota RAV4 | 1 132 000 | + 6 % |
| 2. | Toyota Corolla | 1 104 000 | 0 % |
| 3. | Honda CR-V | 903 000 | +3 % |
| 4. | Nissan Sentra | 693 000 | +1 % |
| 5. | Toyota Camry | 681 000 | +8 % |
| 6. | Honda HR-V | 670 000 | +20 % |
| 7. | Ford F-150 | 562 000 | -8% |
| 8. | Toyota Hilux | 549 000 | +22 % |
| 9. | Tesla Model 3 | 508 000 | +40 % |
| 10. | Honda Accord | 481 000 | -2 % |
| 11. | Honda Civic sedan | 467 000 | -14 % |
| 12. | Nissan X-Trail | 462 000 | +1 % |
| 13. | Toyota Highlander | 443 000 | +30 % |
| 14. | Chevrolet Silverado 1500 | 440 000 | -11 % |
| 15. | Ram 1500 | 432 000 | -8 % |
| 16. | Volkswagen Lavida sedan | 430 000 | -4 % |
| 17. | Hyundai Elantra | 424 000 | +12 % |
| 18. | Nissan Qashqai | 401 000 | -10 % |
| 19. | Tesla Model Y | 392 000 | +412 % |
| 20. | Wuling Hongguang Mini EV | 391 000 | +238 % |
| 21. | Mazda CX-5 | 381 000 | +5 % |
| 22. | Haval H6 | 380 000 | +8 % |
| 23. | Ford Ranger | 364 000 | +10 % |
| 24. | Volkswagen Tiguan Allspace | 360 000 | +2 % |
| 25. | Ford Kuga | 343 000 | -4 % |
| 26. | Volkswagen Jetta | 337 000 | -22 % |
| 27. | Volkswagen T-Cross | 330 000 | +12 % |
| 28. | BMW 3 | 329 000 | +12 % |
| 29. | Hyundai Creta | 328 000 | -2 % |
| 30. | Volkswagen Polo | 326 000 | -6 % |
| 31. | Hyundai Tucson | 320 000 | -25 % |
| 32. | Kia Seltos | 318 000 | +4 % |
| 33. | BMW X3 | 318 000 | +8 % |
| 34. | Suzuki Swift | 315 000 | +9 % |
| 35. | Toyota Yaris | 312 000 | -6 % |
| 36. | Kia Sportage | 308 000 | +3 % |
| 37. | Volkswagen T-Roc | 294 000 | +3 % |
| 38. | Toyota C-HR | 292 000 | -10 % |
| 39. | Isuzu D-Max | 288 000 | +22 % |
| 40. | Hyundai Kona | 285 000 | -8 % |
| 41. | Ford Explorer | 282 000 | +2 % |
| 42. | Toyota Tacoma | 280 000 | +7 % |
| 43. | BMW 5 | 277 000 | +1 % |
| 44. | Nissan Altima | 277 000 | +4 % |
| 45. | Saipa Tiba | 272 000 | +60 % |
| 46. | Buick Excelle GT | 272 000 | -12 % |
| 47. | Jeep Wrangler | 272 000 | +4 % |
| 48. | Mercedec-Benz GLC | 270 000 | -15 % |
| 49. | Volkswagen Golf | 268 000 | -31 % |
| 50. | Peugeot 208 | 268 000 | +13 % |
| 51. | Volkswagen Bora | 266 000 | -20 % |
| 52. | Renault Clio | 262 000 | -19 % |
| 53. | Nissan Almera | 261 000 | +19 % |
| 54. | Honda Jazz | 258 000 | -5 % |
| 55. | Nissan Kicks | 257 000 | +23 % |
| 56. | Audi Q5 | 253 000 | -9 % |
| 57. | Jeep Compass | 252 000 | -1 % |
| 58. | Peugeot 2008 | 244 000 | +28 % |
| 59. | Subaru Impreza | 240 000 | +1 % |
| 60. | BMW X1 | 240 000 | +5 % |
| 61. | Kia Cerato | 239 000 | +11% |
| 62. | Subaru Forester | 237 000 | -11 % |
| 63. | Mercedes-Benz E | 231 000 | -11 % |
| 64. | Hyundai Santa Fe | 231 000 | +6 % |
| 65. | GMC Sierra 1500 | 228 000 | +1 % |
| 66. | Mazda CX-30 | 225 000 | +26 % |
| 67. | Kia Sorento | 223 000 | +6 % |
| 68. | Dacia Sandero | 221 000 | +17 % |
| 69. | Jeep Grand Cherokee | 218 000 | -13 % |
| 70. | Chevrolet Equinox | 218 000 | -13 % |
| 71. | Hyundai Accent | 217 000 | +13 % |
| 72. | Volvo XC60 | 214 000 | +11 % |
| 73. | Jeep Renegade | 213 000 | +4 % |
| 74. | Suzuki Ertiga | 211 000 | +41 % |
| 75. | Lexus RX | 209 000 | +10 % |
| 76. | Hyundai Tucson LWB | 208 000 | 0 % |
| 77. | Kia Optima | 207 000 | -1 % |
| 78. | Changan CS75 Plus | 206 000 | +30 % |
| 79. | Škoda Octavia | 201 000 | -22 % |
| 80. | Volvo XC40 | 200 000 | +7 % |
| 81. | Hyundai Sonata | 200 000 | +12 % |
| 82. | BMW X5 | 199 000 | +16 % |
| 83. | Citroen C3 | 197 000 | +9 % |
| 84. | Opel Corsa | 197 000 | -6 % |
| 85. | Volkswagen Taos | 197 000 | +40 % |
| 86. | Mercedes-Benz C | 197 000 | -16 % |
| 87. | Audi A6 | 196 000 | -12 % |
| 88. | Wuling Hongguang V | 196 000 | -33 % |
| 89. | Subaru Outback | 195 000 | +8 % |
| 90. | Suzuki Baleno | 195 000 | +12 % |
| 91. | Wuling Hongguang | 194 000 | 0 % |
| 92. | Hyundai Venue | 193 000 | +32 % |
| 93. | Volkswagen Tiguan | 193 000 | -14 % |
| 94. | Honda N-Box | 189 000 | -4 % |
| 95. | Volkswagen Passat | 186 000 | -11 % |
| 96. | Lexus ES | 185 000 | -2 % |
| 97. | Audi Q3 | 185 000 | +14 % |
| 98. | Peugeot 3008 | 184 000 | +10 % |
| 99. | Suzuki Wagon R | 184 000 | +24 % |
| 100. | Dacia Duster | 182 000 | +7 % |
| 101. | Mitsubishi Outlander | 182 000 | -3 % |
Buying a used car? ⚠️ Check its history!
Choosing the right used car can be a challenge. Many of them may have minor or major damage, some have a rolled odometer, and some may even be reported stolen.
That's why it's important to always check the history of the car you're about to buy. Fortunately, this can be easily done online at Cebia.com, the largest database of used vehicle records in Europe 🌍. On Cebia.com, you can check the following information (the scope of information varies for each vehicle):
- Odometer Check (Mileage History)
- Damage Check
- Theft Check
- Taxi Check
- Advertisement Photos and Records
- Service History
- Records from State Databases
- and much more
Check vehicle history:
💰 Tip: Want to get a 10% discount on Car History Report? Simply subscribe to our newsletter and we’ll immediately send the discount to your email -> Subscribe.
--------
Check also:
- TOP 100 - The best-selling cars in the world in 2023
- TOP 100 - The best-selling cars in Europe in 2023
- TOP 10 - The best-selling cars in the USA in 2023
- TOP 100 - The best-selling cars in the Czech Republic in 2023
The list was created by analyst and blogger Felipe Munoz based on a survey of sales in 106 global markets accounting for 99% of global car sales.